REPORTS & RESULTS
Financial reports
Trafigura Group publishes half-year and audited annual reports in line with our commitment to open engagement with our stakeholders about our business, including our financial performance.
We have published our financial results every year since 2013, providing industry-leading transparency and disclosure.

2025
2024
2023
Archive
Trafigura’s 2025 Half Year Results
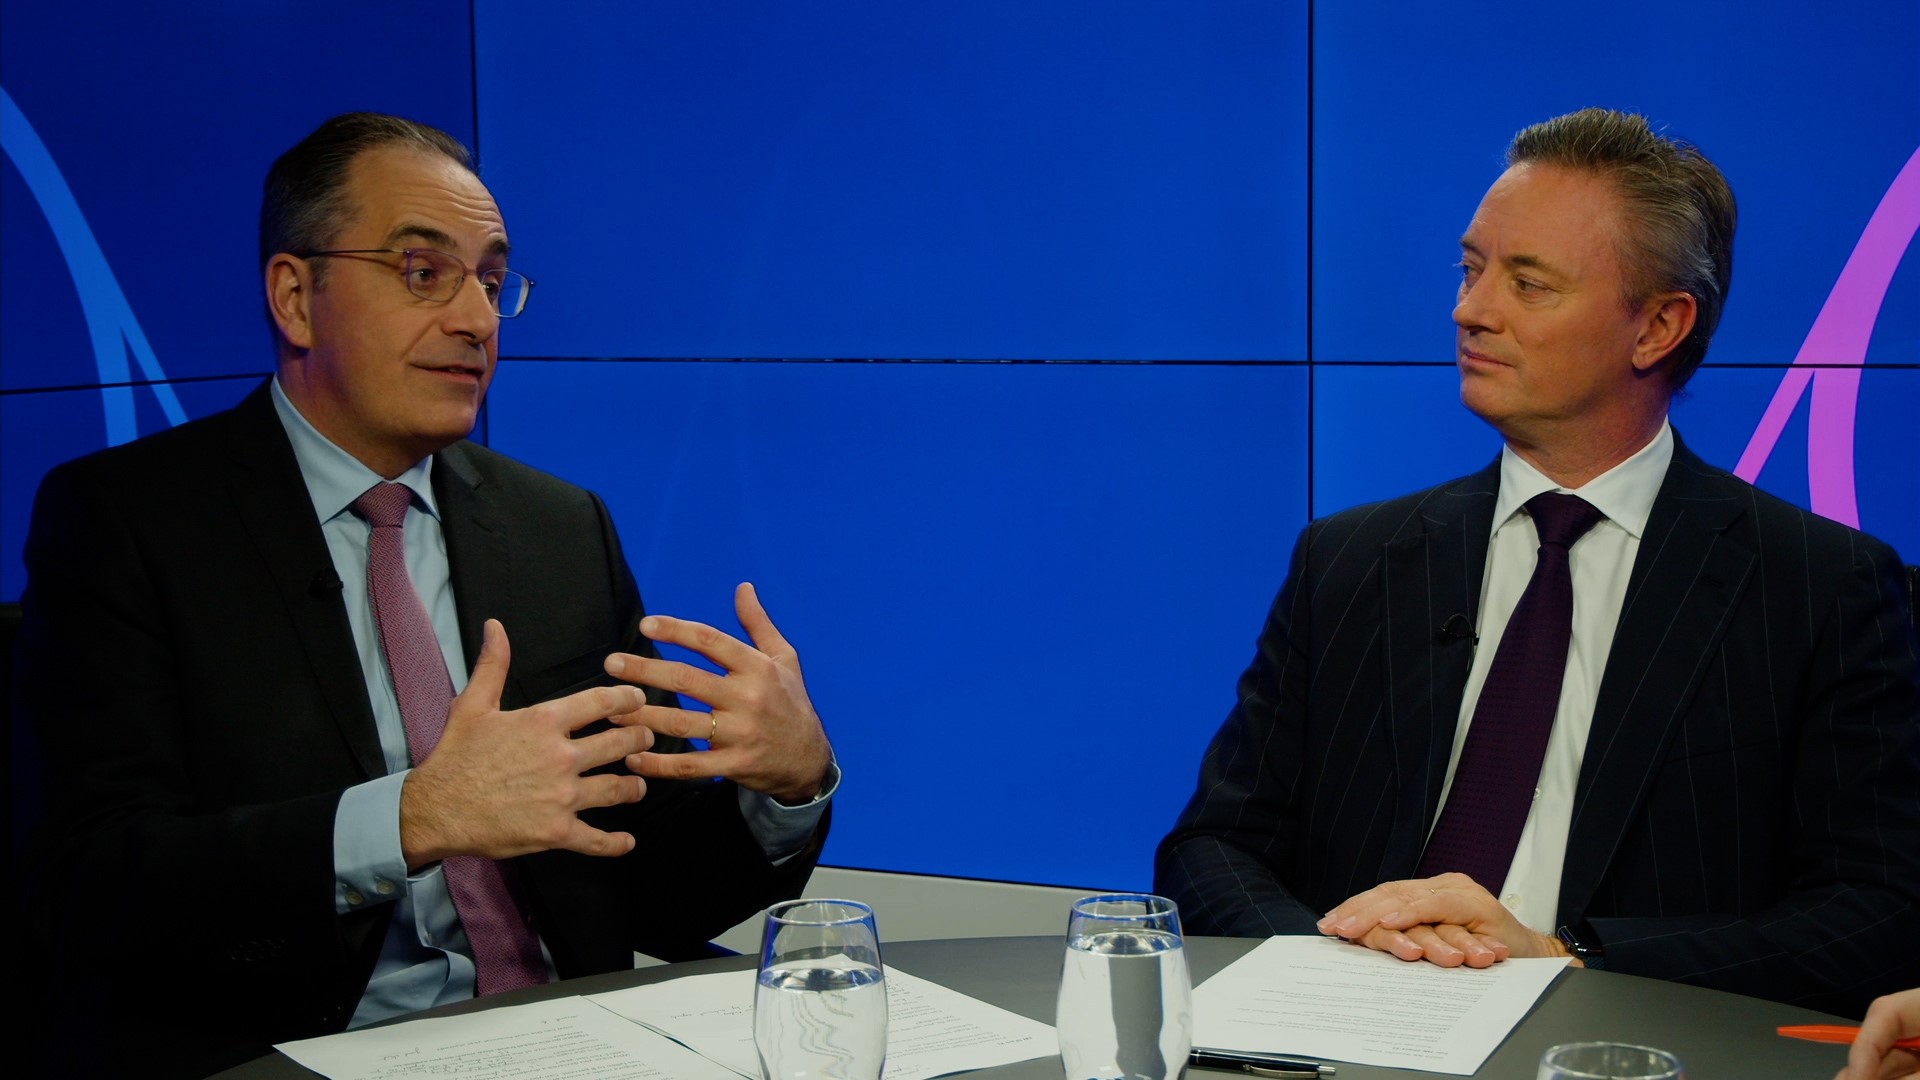
Stephan Jansma, Chief Financial Officer, discusses the Group’s 2025 Half Year results

Stephan Jansma, Chief Financial Officer, discusses the Group’s 2025 Half Year results
Trafigura’s 2024 Annual Results
Jeremy Weir, Executive Chairman and CEO, and Stephan Jansma, CFO, discuss the Group’s performance in 2024

Jeremy Weir, Executive Chairman and CEO, and Stephan Jansma, CFO, discuss the Group’s performance in 2024
Trafigura's 2023 Annual Results
Jeremy Weir our Executive Chairman and CEO, and Christophe Salmon our CFO discuss the Group's performance in 2023
Jeremy Weir, Trafigura Executive Chairman and CEO and Christophe Salmon, our CFO, discuss the Group’s 2023 Annual Results
You may also be interested in
Explore our publications and get the latest news and insights.
4 Oct 2023
-
Press release
